Show code
kw_diversity_group <- alpha_long |>
  group_by(Diversity_metric) |>
  kruskal_test(Value ~ Study_group_new)

kw_diversity_fibre <- alpha_long |>
  group_by(Diversity_metric) |>
kruskal_test(Value ~ Fiber_restriction)Null (each metric): Distributions are equal across groups.
Value (alpha diversity metric).Study_group_new, Fiber_restriction.data/intermediate/alpha_long.rds (from make wrangle).src/mycobiome/03b_diversity_stats.R.| Item | Choice |
|---|---|
| Test | Kruskal–Wallis (rstatix::kruskal_test) |
| Stratification | One test per Diversity_metric (group_by(Diversity_metric)) |
| Formulae | Value ~ Study_group_new; Value ~ Fiber_restriction |
| Post-hoc | Not run in pipeline (Dunn + BH commented in stool_eda.Rmd) |
| Significance | α = 0.05 (uncorrected across metrics) |
kw_diversity_group <- alpha_long |>
group_by(Diversity_metric) |>
kruskal_test(Value ~ Study_group_new)
kw_diversity_fibre <- alpha_long |>
group_by(Diversity_metric) |>
kruskal_test(Value ~ Fiber_restriction)| Diversity_metric | .y. | n | statistic | df | p | method |
|---|---|---|---|---|---|---|
| Chao1 | Value | 16 | 1.4941 | 2 | 0.474 | Kruskal-Wallis |
| Shannon | Value | 16 | 3.5103 | 2 | 0.173 | Kruskal-Wallis |
| Simpson | Value | 16 | 1.4412 | 2 | 0.486 | Kruskal-Wallis |
| Diversity_metric | .y. | n | statistic | df | p | method |
|---|---|---|---|---|---|---|
| Chao1 | Value | 16 | 2.1346 | 3 | 0.545 | Kruskal-Wallis |
| Shannon | Value | 16 | 1.4463 | 3 | 0.695 | Kruskal-Wallis |
| Simpson | Value | 16 | 1.1926 | 3 | 0.755 | Kruskal-Wallis |
Significant by study group (p < 0.05): none
Significant by fibre restriction (p < 0.05): none
Boxplots of alpha diversity by study group (one panel per metric).
p_group <- ggplot(
  alpha_long,
  aes(x = Study_group_new, y = Value, fill = Study_group_new)
) +
  geom_boxplot(outlier.shape = NA, alpha = 0.85) +
  geom_jitter(width = 0.15, alpha = 0.5, size = 1) +
  facet_wrap(~ Diversity_metric, scales = "free_y") +
  labs(
    x = NULL,
    y = "Alpha diversity value",
    fill = "Study group"
  ) +
  theme_minimal() +
  theme(
    legend.position = "none",
    axis.text.x = element_text(angle = 25, hjust = 1)
  )
p_group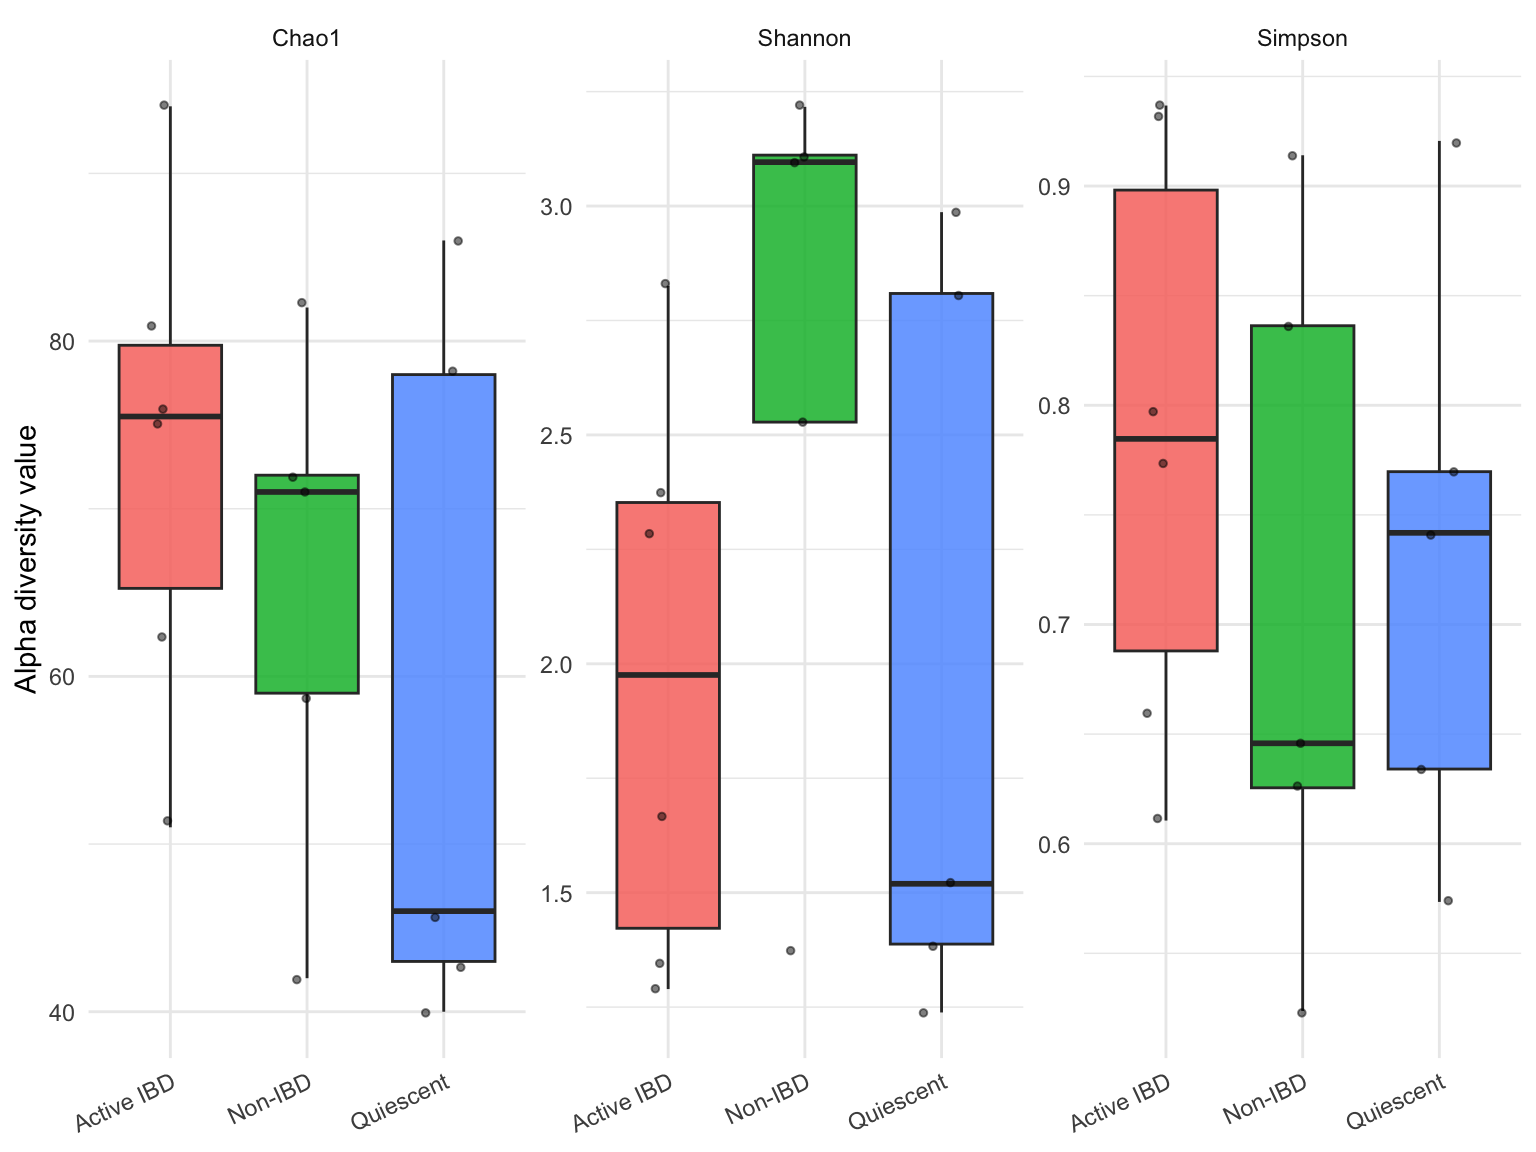
p_fibre <- ggplot(
  alpha_long,
  aes(x = Fiber_restriction, y = Value, fill = Fiber_restriction)
) +
  geom_boxplot(outlier.shape = NA, alpha = 0.85) +
  geom_jitter(width = 0.15, alpha = 0.5, size = 1) +
  facet_wrap(~ Diversity_metric, scales = "free_y") +
  labs(
    x = NULL,
    y = "Alpha diversity value",
    fill = "Fibre Restriction",
    title = "Alpha diversity by fibre restricted diets"
  ) +
  theme_minimal() +
  theme(
    legend.position = "none",
    axis.text.x = element_text(angle = 25, hjust = 1)
  )
p_fibre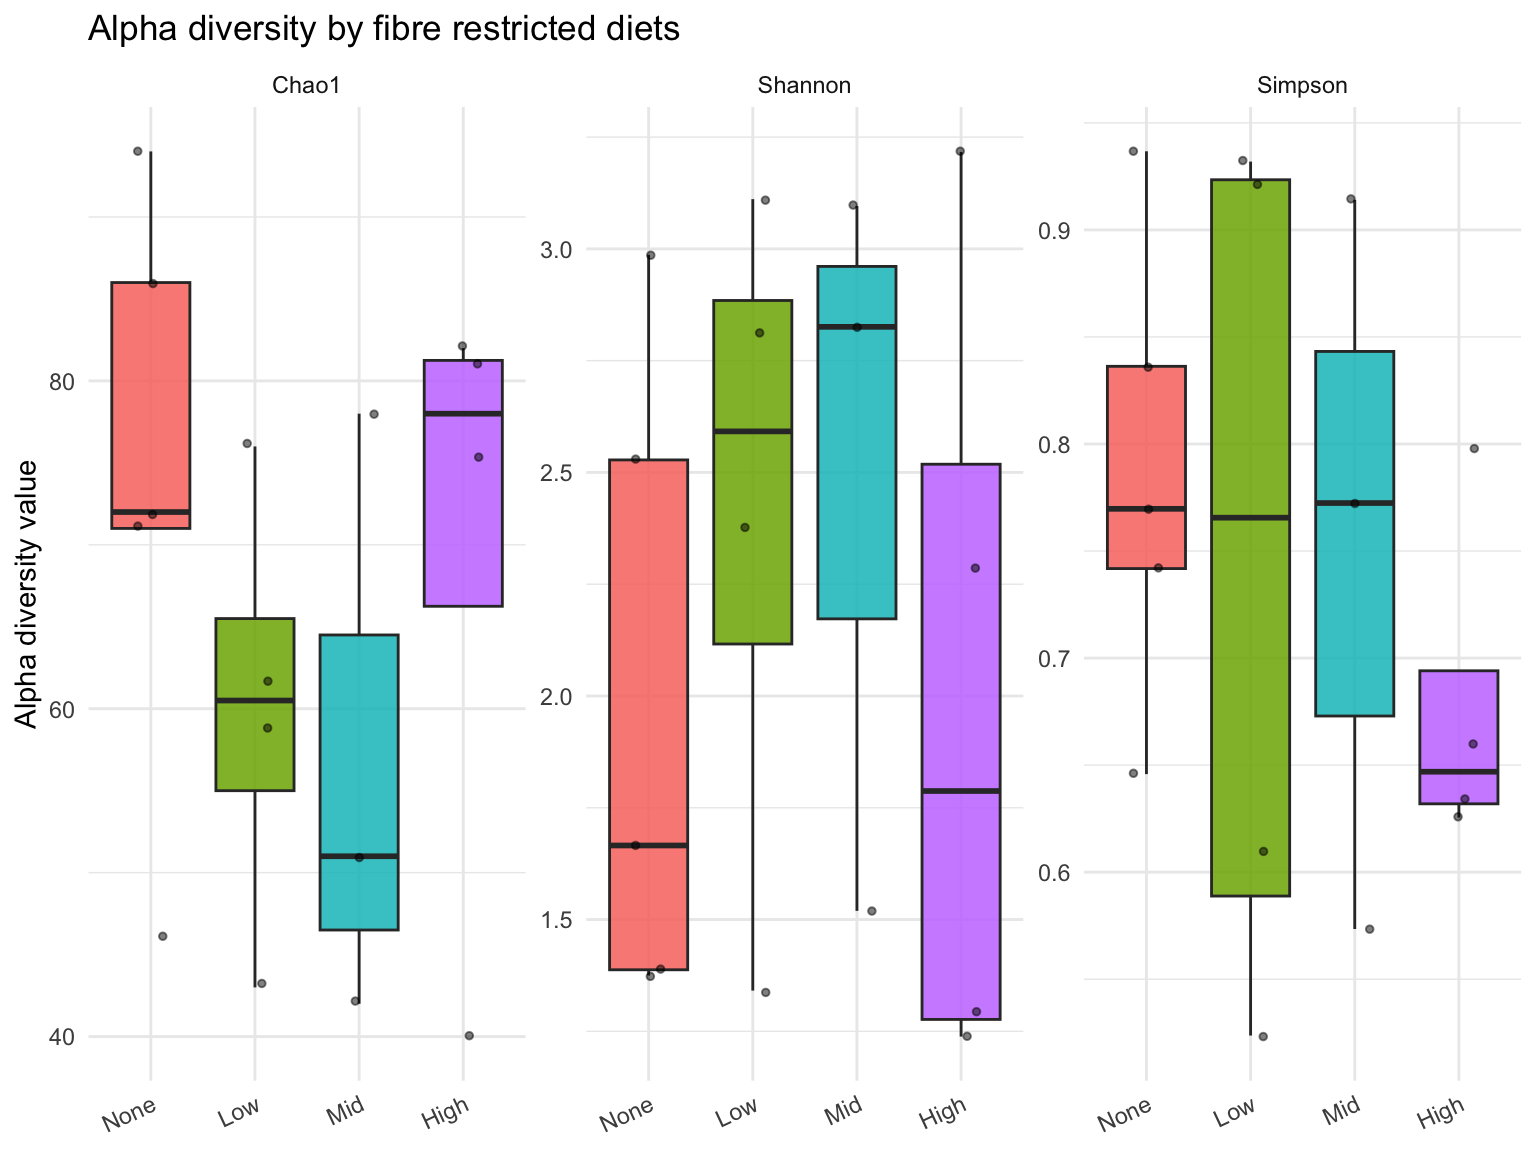
Significant Kruskal–Wallis results indicate at least one group differs in distribution for that metric; they do not identify which pairs differ. Use Dunn tests (with multiplicity adjustment) in a follow-up post if needed.
notebooks/stool_eda.Rmd (§ Inference)make diversity-stats