| Term | Df | Sum of squares | R² | F | Pr(>F) |
|---|---|---|---|---|---|
| Model | 2 | 0.3432 | 0.1404 | 1.0613 | 0.412 |
| Residual | 13 | 2.1020 | 0.8596 | NA | NA |
| Total | 15 | 2.4452 | 1.0000 | NA | NA |
PERMANOVA phylum beta diversity by study group
permanova
beta-diversity
phylum
pre-specified
Bray–Curtis dissimilarity on phylum relative abundance; study-group effect tested with permutational MANOVA.
1 Research question
Does study group explain differences in phylum-level community composition?
Null: Multivariate centroids do not differ among study groups (PERMANOVA on Bray–Curtis distances).
2 Data
- Response: Phylum relative abundance (
p__*columns after wide reshape). - Predictor:
Study_group_new. - Input:
data/processed/phylum.csv(long format frommake save; pivoted in this post).
3 Methods
| Item | Choice |
|---|---|
| Test | PERMANOVA (vegan::adonis2) |
| Distance | Bray–Curtis |
| Formula | dist ~ Study_group_new |
| Permutations | 999 |
| Visualization | PCoA (cmdscale, k = 2), 95% ellipses |
4 Results
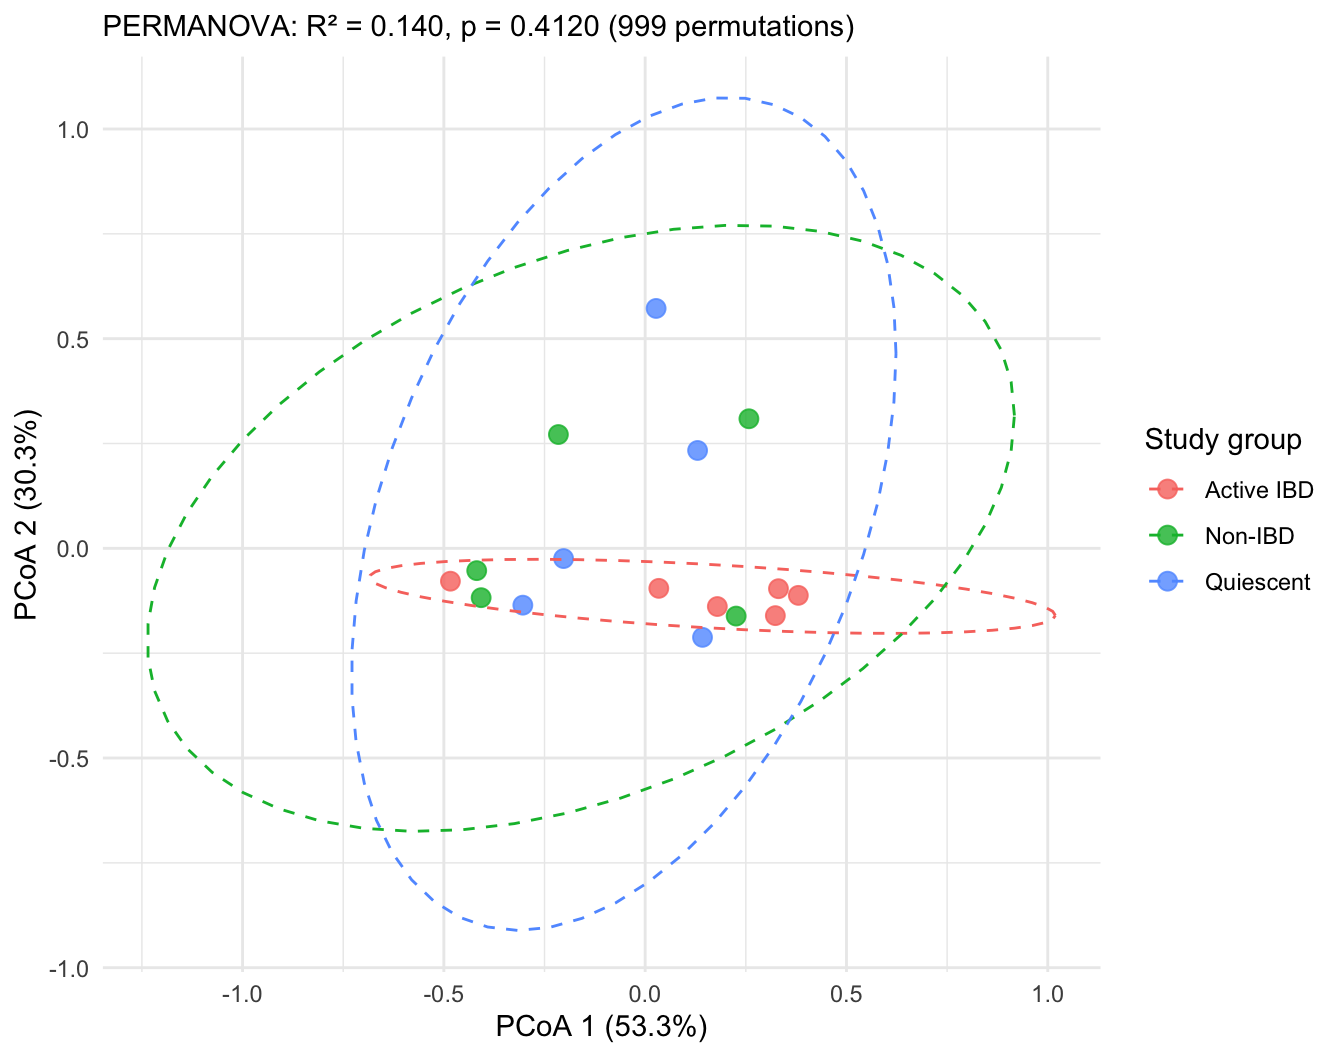
Study group explained 14.0% of variance in Phylum composition (R² = 0.140; pseudo-F = 1.06; p = 0.4120, 999 permutations).
5 Figure
Show code
plot_pcoa_study_group(
  fit$dist,
  fit$metadata,
  permanova_result,
  cfg$label
)
6 Reproducibility
- Helpers:
stats/R/permanova_helpers.R - Pipeline:
make wrangle→make save - Related: species/genus/family posts in this log;
notebooks/permanova.Rmd