Show code
spearman_results <- spearman_symptom_alpha(sample_symptoms)

permanova_hbi <- run_permanova_symptom(
  genus_wide,
  prefix = TAXA_LEVELS$genus$prefix,
  symptom_col = "harvey_bradshaw_index"
)Are symptom scores from participant surveys associated with fungal composition (alpha and beta diversity)?
Null (Spearman): No monotonic association between each symptom score and each alpha diversity metric.
Null (PERMANOVA): Genus-level community composition is not associated with the symptom score after accounting for Bray–Curtis distance structure.
| Role | Source |
|---|---|
| Mycobiome (alpha) | data/intermediate/alpha_long.rds (make wrangle) |
| Mycobiome (genus beta) | data/processed/genus.csv (make save) |
| Survey / symptoms | data/processed/cleaned_characteristics.csv (make characteristics on data/raw/SYN_Participant Characteristics(Sheet1).csv) |
Participant_ID (mycobiome) = participant_id (characteristics); one characteristics row per participant used when duplicates exist.Mild = 1, 4\tSOME OF THE TIME → 4). Primary focus: Harvey–Bradshaw Index (HBI); additional exploratory symptoms in the correlation table.02_data_wrangling.R removals; PERMANOVA genus analysis uses samples with non-missing HBI.Coverage: 16 samples, 12 participants; 16 samples with non-missing HBI.
| Item | Spearman (symptoms × alpha) | PERMANOVA (symptoms × taxa) |
|---|---|---|
| Test | Spearman rank correlation (cor.test, method = "spearman") |
vegan::adonis2 |
| Response | Shannon, Simpson, Chao1 | Genus Bray–Curtis dissimilarity |
| Predictor | Parsed symptom scores | Harvey–Bradshaw Index (continuous) |
| Multiple testing | Benjamini–Hochberg across all symptom × metric pairs | Exploratory single predictor |
| Permutations | — | 999 |
| Significance | α = 0.05 | α = 0.05 |
spearman_results <- spearman_symptom_alpha(sample_symptoms)
permanova_hbi <- run_permanova_symptom(
genus_wide,
prefix = TAXA_LEVELS$genus$prefix,
symptom_col = "harvey_bradshaw_index"
)| Symptom | Alpha metric | n | Spearman rho | p | BH-adjusted p |
|---|---|---|---|---|---|
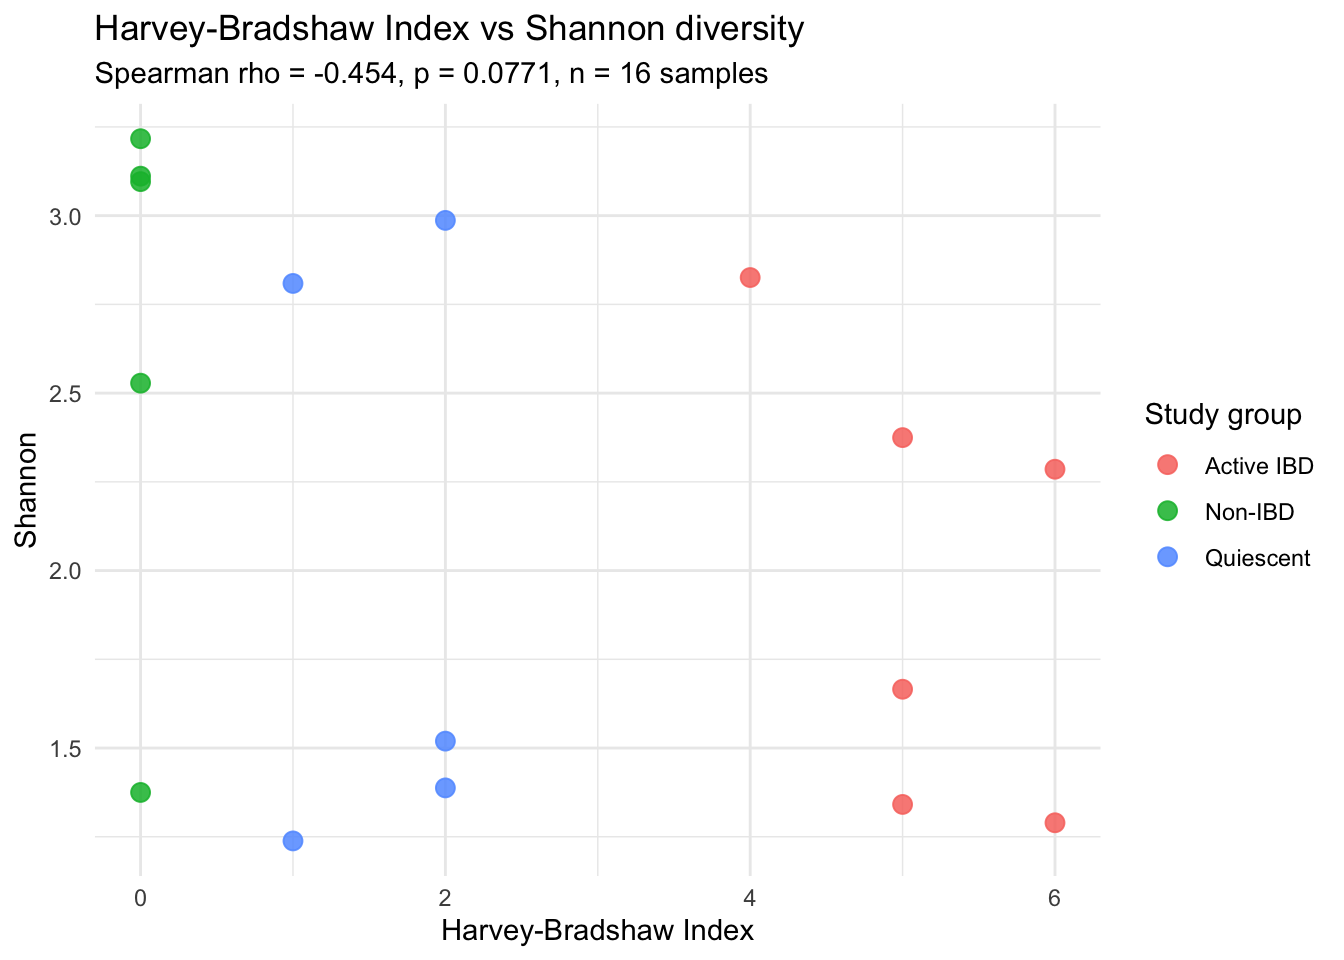
| Harvey-Bradshaw Index | Shannon | 16 | -0.4543 | 0.0771 | 0.6620 |
| Harvey-Bradshaw Index | Simpson | 16 | 0.2331 | 0.3849 | 0.7339 |
| Harvey-Bradshaw Index | Chao1 | 16 | 0.3595 | 0.1715 | 0.6620 |
| Daily soft stools | Shannon | 16 | 0.2205 | 0.4118 | 0.7339 |
| Daily soft stools | Simpson | 16 | -0.0214 | 0.9372 | 0.9406 |
| Daily soft stools | Chao1 | 16 | -0.2757 | 0.3014 | 0.6782 |
| Abdominal pain | Shannon | 16 | -0.3009 | 0.2574 | 0.6620 |
| Abdominal pain | Simpson | 16 | -0.0203 | 0.9406 | 0.9406 |
| Abdominal pain | Chao1 | 16 | -0.0483 | 0.8589 | 0.9406 |
| Fatigue frequency | Shannon | 16 | 0.3156 | 0.2337 | 0.6620 |
| Fatigue frequency | Simpson | 16 | -0.1593 | 0.5556 | 0.7339 |
| Fatigue frequency | Chao1 | 16 | -0.1683 | 0.5332 | 0.7339 |
| Anxiety frequency | Shannon | 16 | -0.0932 | 0.7314 | 0.8777 |
| Anxiety frequency | Simpson | 16 | 0.1533 | 0.5708 | 0.7339 |
| Anxiety frequency | Chao1 | 16 | -0.3367 | 0.2023 | 0.6620 |
| Abdominal bloating frequency | Shannon | 16 | -0.1894 | 0.4824 | 0.7339 |
| Abdominal bloating frequency | Simpson | 16 | -0.3277 | 0.2154 | 0.6620 |
| Abdominal bloating frequency | Chao1 | 16 | 0.3848 | 0.1411 | 0.6620 |
No symptom × alpha pairs were significant after BH adjustment (q < 0.05).
| Term | Df | Sum of squares | R² | F | Pr(>F) |
|---|---|---|---|---|---|
| Model | 1 | 0.1006 | 0.059 | 0.8786 | 0.658 |
| Residual | 14 | 1.6035 | 0.941 | NA | NA |
| Total | 15 | 1.7041 | 1.000 | NA | NA |
Harvey–Bradshaw Index explained 5.9% of variance in genus composition (R² = 0.059; pseudo-F = 0.88; p = 0.6580, 999 permutations; n = 16 samples with HBI).
plot_symptom_alpha_scatter(
  sample_symptoms,
  symptom_col = "harvey_bradshaw_index",
  metric = "Shannon"
)
plot_pcoa_symptom(
  permanova_hbi,
  TAXA_LEVELS$genus$label
)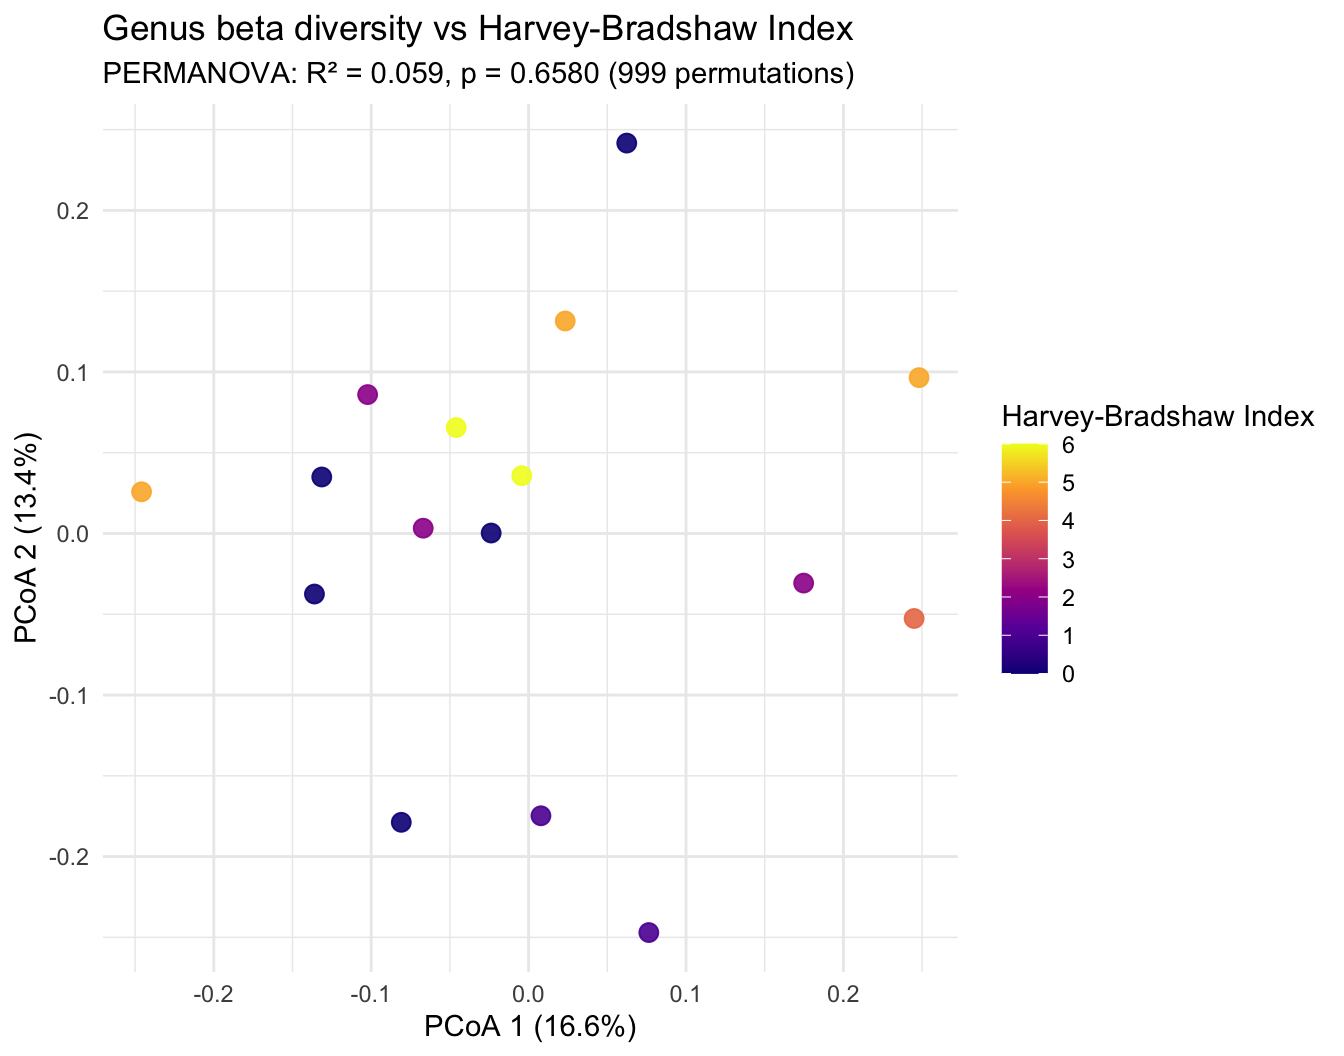
Spearman correlations describe pairwise monotonic links between symptom scores and alpha metrics at the sample level; they do not adjust for repeated measures per participant. PERMANOVA tests whether multivariate genus composition covaries with HBI across samples; a non-significant p-value does not rule out associations with individual taxa or other symptom instruments.
Correlation among symptoms and small sample size limit power; treat findings as exploratory unless pre-registered.
stats/R/symptom_association_helpers.R, stats/R/permanova_helpers.Rmake merge builds data/processed/merged.csv for dashboard use; this post joins the same sources directly.quarto render stats from repository root