Show code
# Results objects created in setup: pca_fit, cluster_fit, scoresCan participants be grouped by combined diet (nutrients) and mycobiome (genus taxa) profiles?
Pre-specified method; exploratory interpretation: with 12 participants, PCA and clustering describe patterns in the data but do not provide stable cluster validation (no formal cluster significance testing).
| Role | Source |
|---|---|
| Genus taxa | data/processed/genus.csv (make save) |
| Diet | data/processed/dietary_cleaned.xlsx |
| Disease group (reference) | Study_group_new on mycobiome metadata |
Participant_ID).merge_files.R).NUTRIENT_FIELDS plus all genus columns (g__*) with non-zero variance across participants.Coverage: 12 participants, 51 features (11 nutrients + 40 genera).
| Item | Choice |
|---|---|
| Integration | Left-join participant-mean genus abundances and nutrients on Participant_ID |
| PCA | stats::prcomp, center = TRUE, scale. = TRUE |
| Clustering | Hierarchical (Ward.D2) on Euclidean distance of scaled features |
| Cluster sizes | k = 2 and k = 3 (cutree) |
| Reference labels | Study_group_new overlaid on PCA (not used to fit clusters) |
| Notebook reference | notebooks/pca_tsne.Rmd (taxa-only PCA/t-SNE) |
# Results objects created in setup: pca_fit, cluster_fit, scores| PC | Component | Variance (%) | Cumulative (%) |
|---|---|---|---|
| PC1 | 1 | 16.08 | 16.08 |
| PC2 | 2 | 14.71 | 30.79 |
| PC3 | 3 | 12.25 | 43.04 |
| PC4 | 4 | 11.66 | 54.71 |
| PC5 | 5 | 9.85 | 64.56 |
| PC6 | 6 | 8.72 | 73.28 |
| PC7 | 7 | 7.88 | 81.16 |
| PC8 | 8 | 6.61 | 87.76 |
| PC9 | 9 | 5.18 | 92.94 |
| PC10 | 10 | 3.85 | 96.80 |
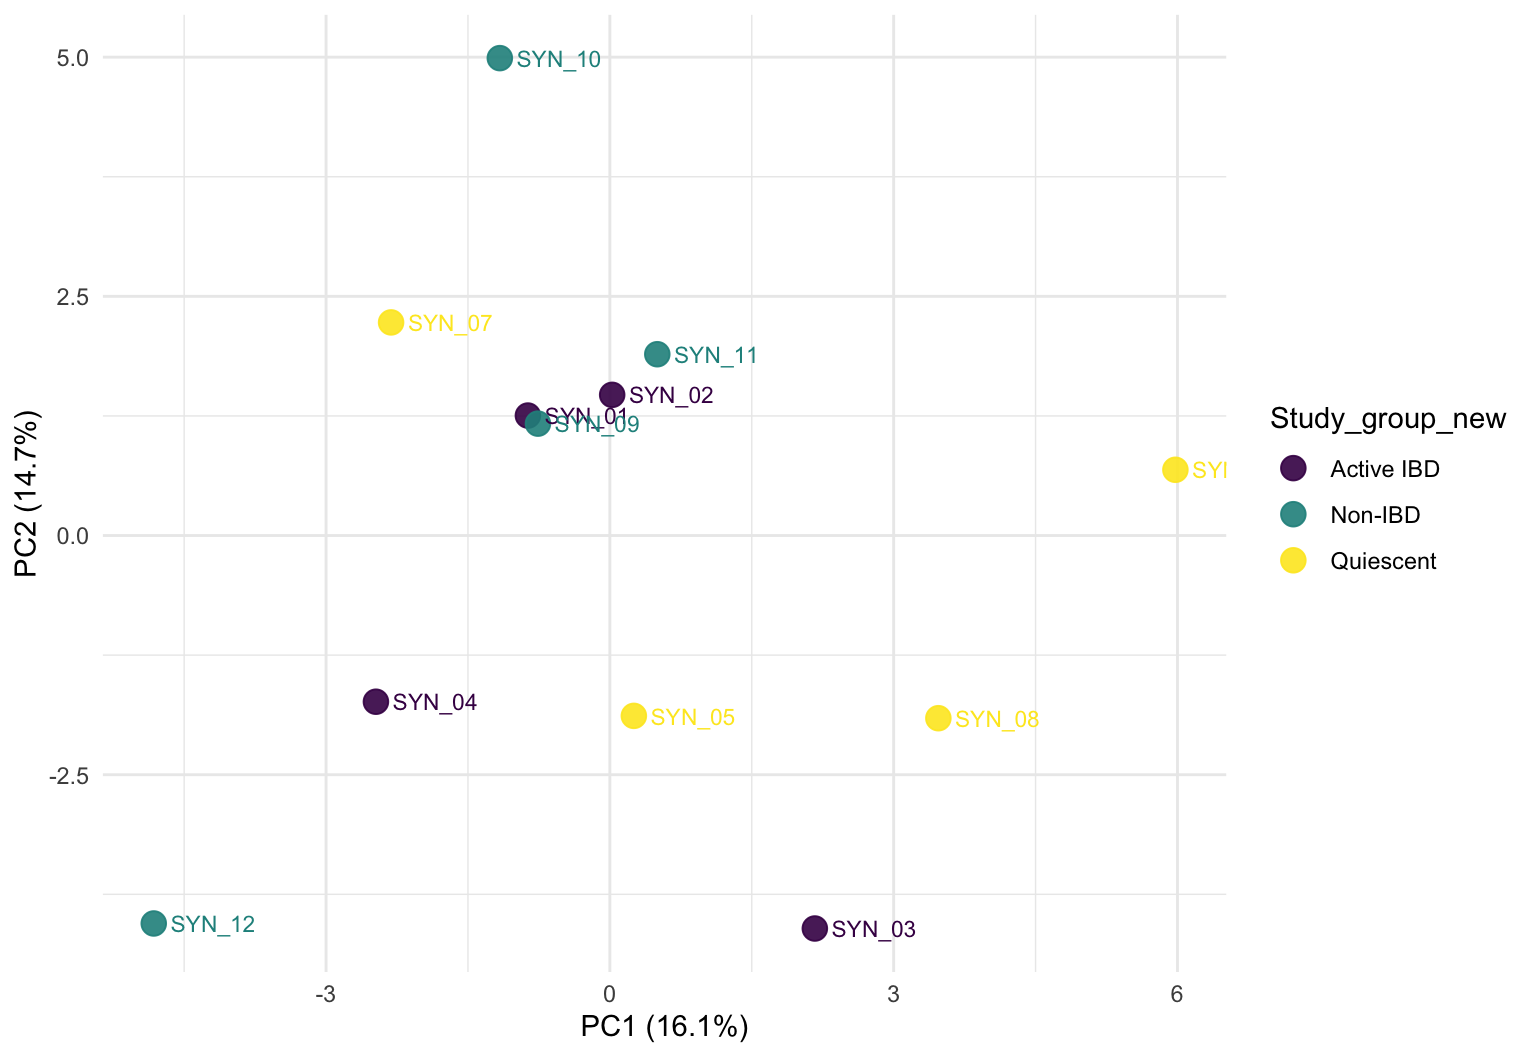
PC1 and PC2 explain 16.1% and 14.7% of variance (cumulative PC1–3: 43.0%).
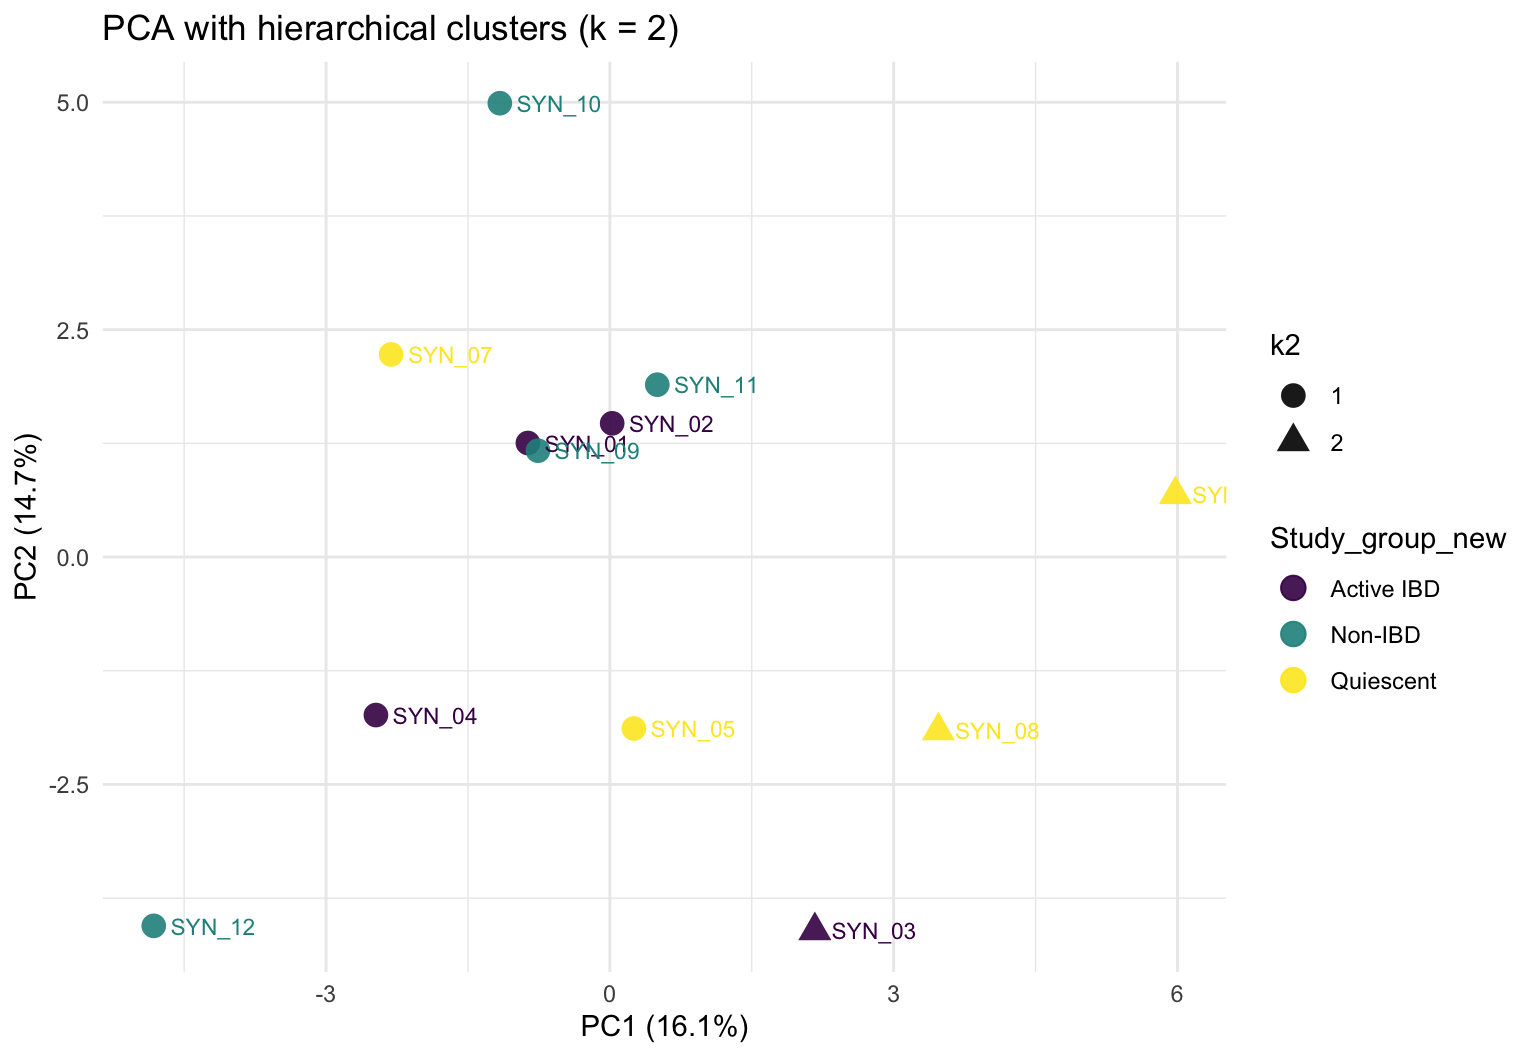
| cluster | Active IBD | Non-IBD | Quiescent |
|---|---|---|---|
| 1 | 3 | 4 | 2 |
| 2 | 1 | 0 | 2 |
| cluster | Active IBD | Non-IBD | Quiescent |
|---|---|---|---|
| 1 | 2 | 3 | 2 |
| 2 | 1 | 0 | 2 |
| 3 | 1 | 1 | 0 |
Clusters are unsupervised and need not align with clinical study group. Compare tables and PCA colours to see whether diet–mycobiome structure tracks disease status or forms separate groupings.
plot_pca_variance(pca_fit$variance_df, max_pc = min(10L, n_participants))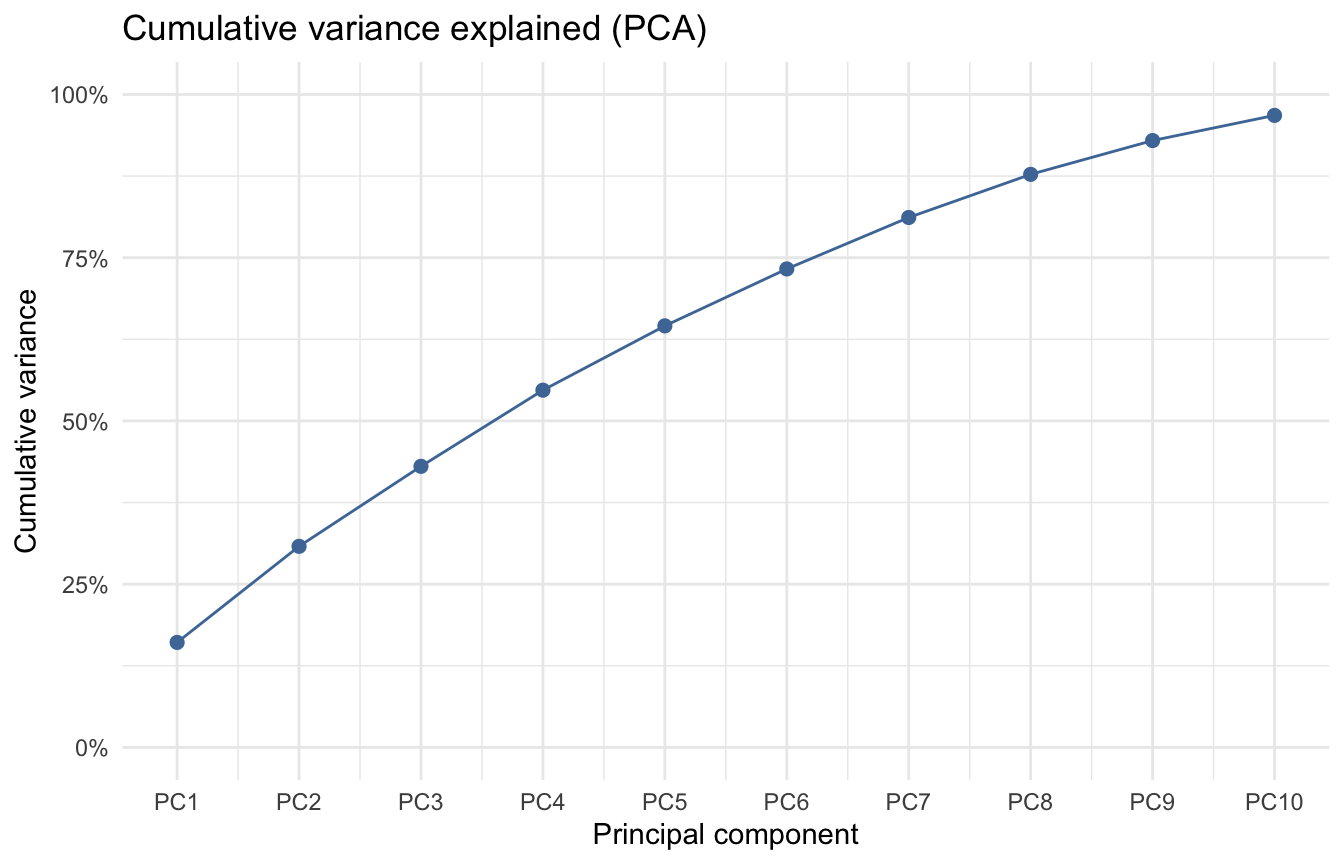
plot_pca_scores(
  scores,
  colour_col = "Study_group_new",
  variance_df = pca_fit$variance_df,
  title = NULL
)
plot_pca_scores(
  scores,
  colour_col = "Study_group_new",
  shape_col = "k2",
  variance_df = pca_fit$variance_df,
  title = "PCA with hierarchical clusters (k = 2)"
)
plot_top_pca_loadings(pca_fit$loadings, pc = "PC1", n_top = 10L)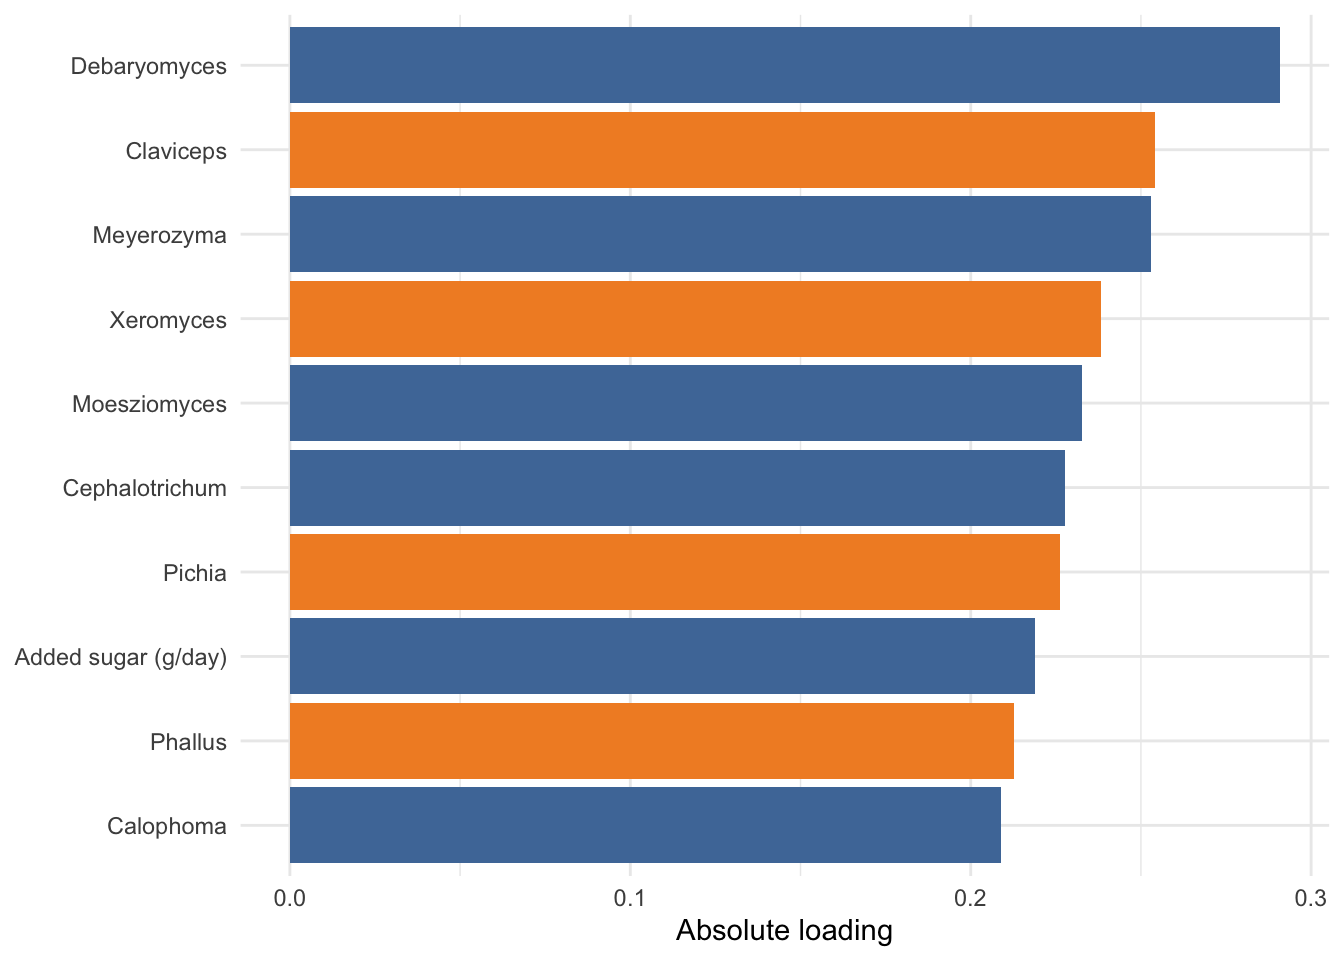
plot_cluster_dendrogram(cluster_fit)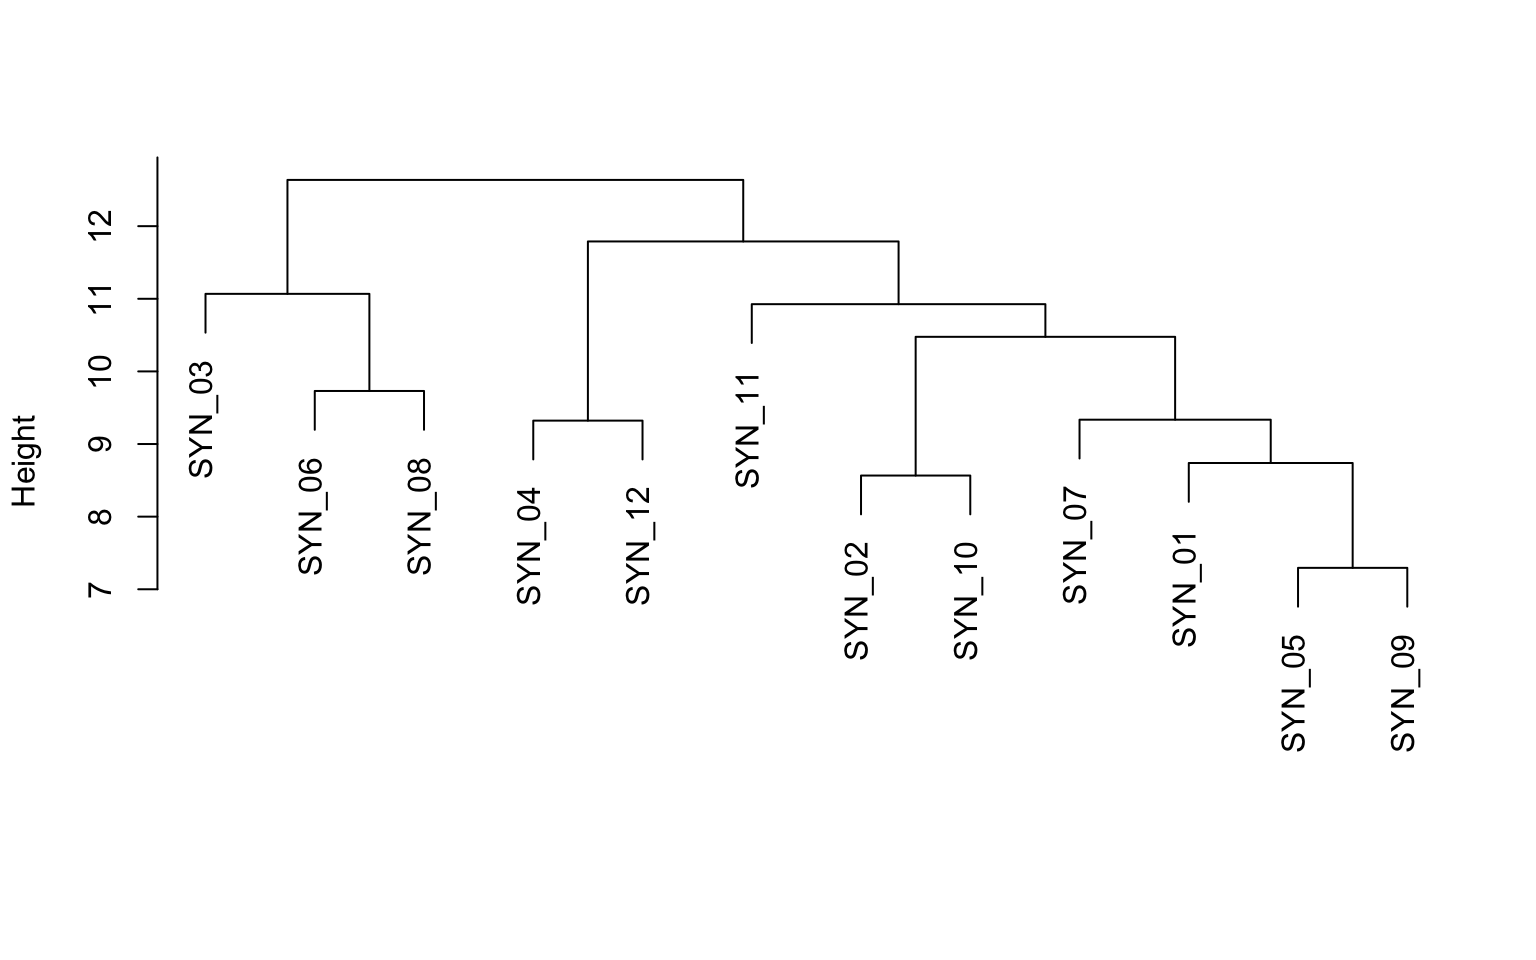
PCA reduces the joint nutrient + genus feature space to orthogonal axes for visualization. If participants with similar diets and mycobiomes sit near each other, they may form visual groups; formal cluster validity was not assessed (silhouette, gap statistic, etc.) given small n.
Hierarchical clusters partition participants without using Study_group_new. Agreement between clusters and clinical group supports an integrated diet–mycobiome signal; disagreement suggests heterogeneity within disease labels or driven by diet/taxa not captured by group alone.
stats/R/pca_clustering_helpers.R, stats/R/nutrient_association_helpers.R, stats/R/permanova_helpers.Rnotebooks/pca_tsne.Rmd (taxa-only PCA/t-SNE)quarto render stats from repository root