Show code
top_validation <- ranked |>
  filter(validation_tier %in% c("High", "Medium")) |>
slice_head(n = 10)Which disease-group (Study_group_new) findings are strongest candidates for future validation?
We synthesize tests already run across the capstone pipeline into a single evidence-ranking matrix, ordered by a transparent score combining p-value and effect size.
| Domain | Tests included | Primary inputs |
|---|---|---|
| Mycobiome (beta) | PERMANOVA × taxonomic level | data/processed/{phylum,family,genus,species}.csv |
| Mycobiome (alpha) | Kruskal–Wallis × diversity metric | data/intermediate/alpha_long.rds |
| Diet | Kruskal–Wallis × nutrient | data/processed/dietary_cleaned.xlsx + mycobiome metadata |
| Symptoms | Kruskal–Wallis × symptom score | data/processed/cleaned_characteristics.csv + mycobiome metadata |
Study_group_new).Summary: 24 study-group comparisons ranked; 1 with p < 0.05; 1 tagged High priority.
| Item | Choice |
|---|---|
| Integration | Recompute or aggregate from processed/intermediate files (same sources as individual posts) |
| Beta diversity | PERMANOVA (adonis2), Bray–Curtis, 999 permutations; effect = R² |
| Alpha, diet, symptoms | Kruskal–Wallis; effect = η²[H] (rstatix::kruskal_effsize) |
| Evidence score | −log₁₀(p) × (0.5 + 0.5 × effect_scaled) with R² or η²[H] capped at 1 |
| Validation tier | High: p < 0.05 and score ≥ 75th percentile among significant; Medium: p < 0.05; Suggestive: p < 0.10; Low: otherwise |
| Multiplicity | Exploratory ranking; no global FDR across all rows |
top_validation <- ranked |>
filter(validation_tier %in% c("High", "Medium")) |>
slice_head(n = 10)| Rank | Tier | Domain | Feature | Test | Effect | Statistic | p | n | Evidence score | Source post |
|---|---|---|---|---|---|---|---|---|---|---|
| 1 | High | Symptoms (survey) | Harvey-Bradshaw Index | Kruskal–Wallis | η²[H] = 0.924 | 10.3150 | 0.0058 | 12 | 2.1544 | 2026-05-22-symptoms-fungal-composition |
| 2 | Suggestive | Diet (nutrients) | Added sugar (g/day) | Kruskal–Wallis | η²[H] = 0.423 | 5.8077 | 0.0548 | 12 | 0.8974 | 2026-05-29-nutrients-diversity-disease-group |
| 3 | Low | Mycobiome (alpha diversity) | Shannon diversity | Kruskal–Wallis | η²[H] = 0.116 | 3.5103 | 0.1730 | 16 | 0.4252 | 2026-05-19-alpha-diversity-kruskal-wallis |
| 4 | Low | Diet (nutrients) | Fat (g/day) | Kruskal–Wallis | η²[H] = 0.137 | 3.2308 | 0.1990 | 12 | 0.3985 | 2026-05-29-nutrients-diversity-disease-group |
| 5 | Low | Mycobiome (beta diversity) | Species composition | PERMANOVA (Bray–Curtis) | R² = 0.145 | 1.1061 | 0.2660 | 16 | 0.3294 | 2026-05-19-permanova-species-beta-diversity |
| 6 | Low | Mycobiome (beta diversity) | Family composition | PERMANOVA (Bray–Curtis) | R² = 0.142 | 1.0773 | 0.3730 | 16 | 0.2446 | 2026-05-19-permanova-family-beta-diversity |
| 7 | Low | Mycobiome (beta diversity) | Phylum composition | PERMANOVA (Bray–Curtis) | R² = 0.140 | 1.0613 | 0.4120 | 16 | 0.2196 | 2026-05-19-permanova-phylum-beta-diversity |
| 8 | Low | Diet (nutrients) | Vitamin D (mcg/day) | Kruskal–Wallis | η²[H] = 0.000 | 2.0000 | 0.3680 | 12 | 0.2171 | 2026-05-29-nutrients-diversity-disease-group |
| 9 | Low | Diet (nutrients) | Sugar (g/day) | Kruskal–Wallis | η²[H] = -0.013 | 1.8846 | 0.3900 | 12 | 0.2045 | 2026-05-29-nutrients-diversity-disease-group |
| 10 | Low | Diet (nutrients) | Omega-6 (g/day) | Kruskal–Wallis | η²[H] = -0.013 | 1.8846 | 0.3900 | 12 | 0.2045 | 2026-05-29-nutrients-diversity-disease-group |
| 11 | Low | Diet (nutrients) | Calories (kcal/day) | Kruskal–Wallis | η²[H] = -0.056 | 1.5000 | 0.4720 | 12 | 0.1630 | 2026-05-29-nutrients-diversity-disease-group |
| 12 | Low | Mycobiome (alpha diversity) | Chao1 diversity | Kruskal–Wallis | η²[H] = -0.039 | 1.4941 | 0.4740 | 16 | 0.1621 | 2026-05-19-alpha-diversity-kruskal-wallis |
| 13 | Low | Mycobiome (alpha diversity) | Simpson diversity | Kruskal–Wallis | η²[H] = -0.043 | 1.4412 | 0.4860 | 16 | 0.1567 | 2026-05-19-alpha-diversity-kruskal-wallis |
| 14 | Low | Diet (nutrients) | Folate (mcg/day) | Kruskal–Wallis | η²[H] = -0.064 | 1.4231 | 0.4910 | 12 | 0.1545 | 2026-05-29-nutrients-diversity-disease-group |
| 15 | Low | Diet (nutrients) | Artificial sweeteners (mg/day) | Kruskal–Wallis | η²[H] = -0.090 | 1.1923 | 0.5510 | 12 | 0.1294 | 2026-05-29-nutrients-diversity-disease-group |
| 16 | Low | Symptoms (survey) | Fatigue frequency | Kruskal–Wallis | η²[H] = -0.098 | 1.1200 | 0.5710 | 12 | 0.1217 | 2026-05-22-symptoms-fungal-composition |
| 17 | Low | Symptoms (survey) | Abdominal pain | Kruskal–Wallis | η²[H] = -0.146 | 0.6875 | 0.7090 | 12 | 0.0747 | 2026-05-22-symptoms-fungal-composition |
| 18 | Low | Diet (nutrients) | Tryptophan (g/day) | Kruskal–Wallis | η²[H] = -0.171 | 0.4615 | 0.7940 | 12 | 0.0501 | 2026-05-29-nutrients-diversity-disease-group |
| 19 | Low | Mycobiome (beta diversity) | Genus composition | PERMANOVA (Bray–Curtis) | R² = 0.108 | 0.7896 | 0.8520 | 16 | 0.0385 | 2026-05-19-permanova-genus-beta-diversity |
| 20 | Low | Diet (nutrients) | Omega-3 (g/day) | Kruskal–Wallis | η²[H] = -0.192 | 0.2692 | 0.8740 | 12 | 0.0292 | 2026-05-29-nutrients-diversity-disease-group |
| 21 | Low | Symptoms (survey) | Anxiety frequency | Kruskal–Wallis | η²[H] = -0.204 | 0.1600 | 0.9230 | 12 | 0.0174 | 2026-05-22-symptoms-fungal-composition |
| 22 | Low | Symptoms (survey) | Abdominal bloating frequency | Kruskal–Wallis | η²[H] = -0.204 | 0.1600 | 0.9230 | 12 | 0.0174 | 2026-05-22-symptoms-fungal-composition |
| 23 | Low | Diet (nutrients) | Total fiber (g/day) | Kruskal–Wallis | η²[H] = -0.205 | 0.1538 | 0.9260 | 12 | 0.0167 | 2026-05-29-nutrients-diversity-disease-group |
| 24 | Low | Symptoms (survey) | Daily soft stools | Kruskal–Wallis | η²[H] = -0.222 | 0.0000 | 1.0000 | 12 | 0.0000 | 2026-05-22-symptoms-fungal-composition |
| rank | validation_tier | domain | feature | test | effect_label | p | evidence_score |
|---|---|---|---|---|---|---|---|
| 1 | High | Symptoms (survey) | Harvey-Bradshaw Index | Kruskal–Wallis | η²[H] = 0.924 | 0.0058 | 2.1544 |
Top validation candidates:
| Domain | Tests | p < 0.05 | Mean evidence score | Top feature |
|---|---|---|---|---|
| Diet (nutrients) | 11 | 0 | 0.224 | Added sugar (g/day) |
| Mycobiome (alpha diversity) | 3 | 0 | 0.248 | Shannon diversity |
| Mycobiome (beta diversity) | 4 | 0 | 0.208 | Species composition |
| Symptoms (survey) | 6 | 1 | 0.398 | Harvey-Bradshaw Index |
plot_evidence_heatmap(ranked, top_n = min(20L, nrow(ranked)))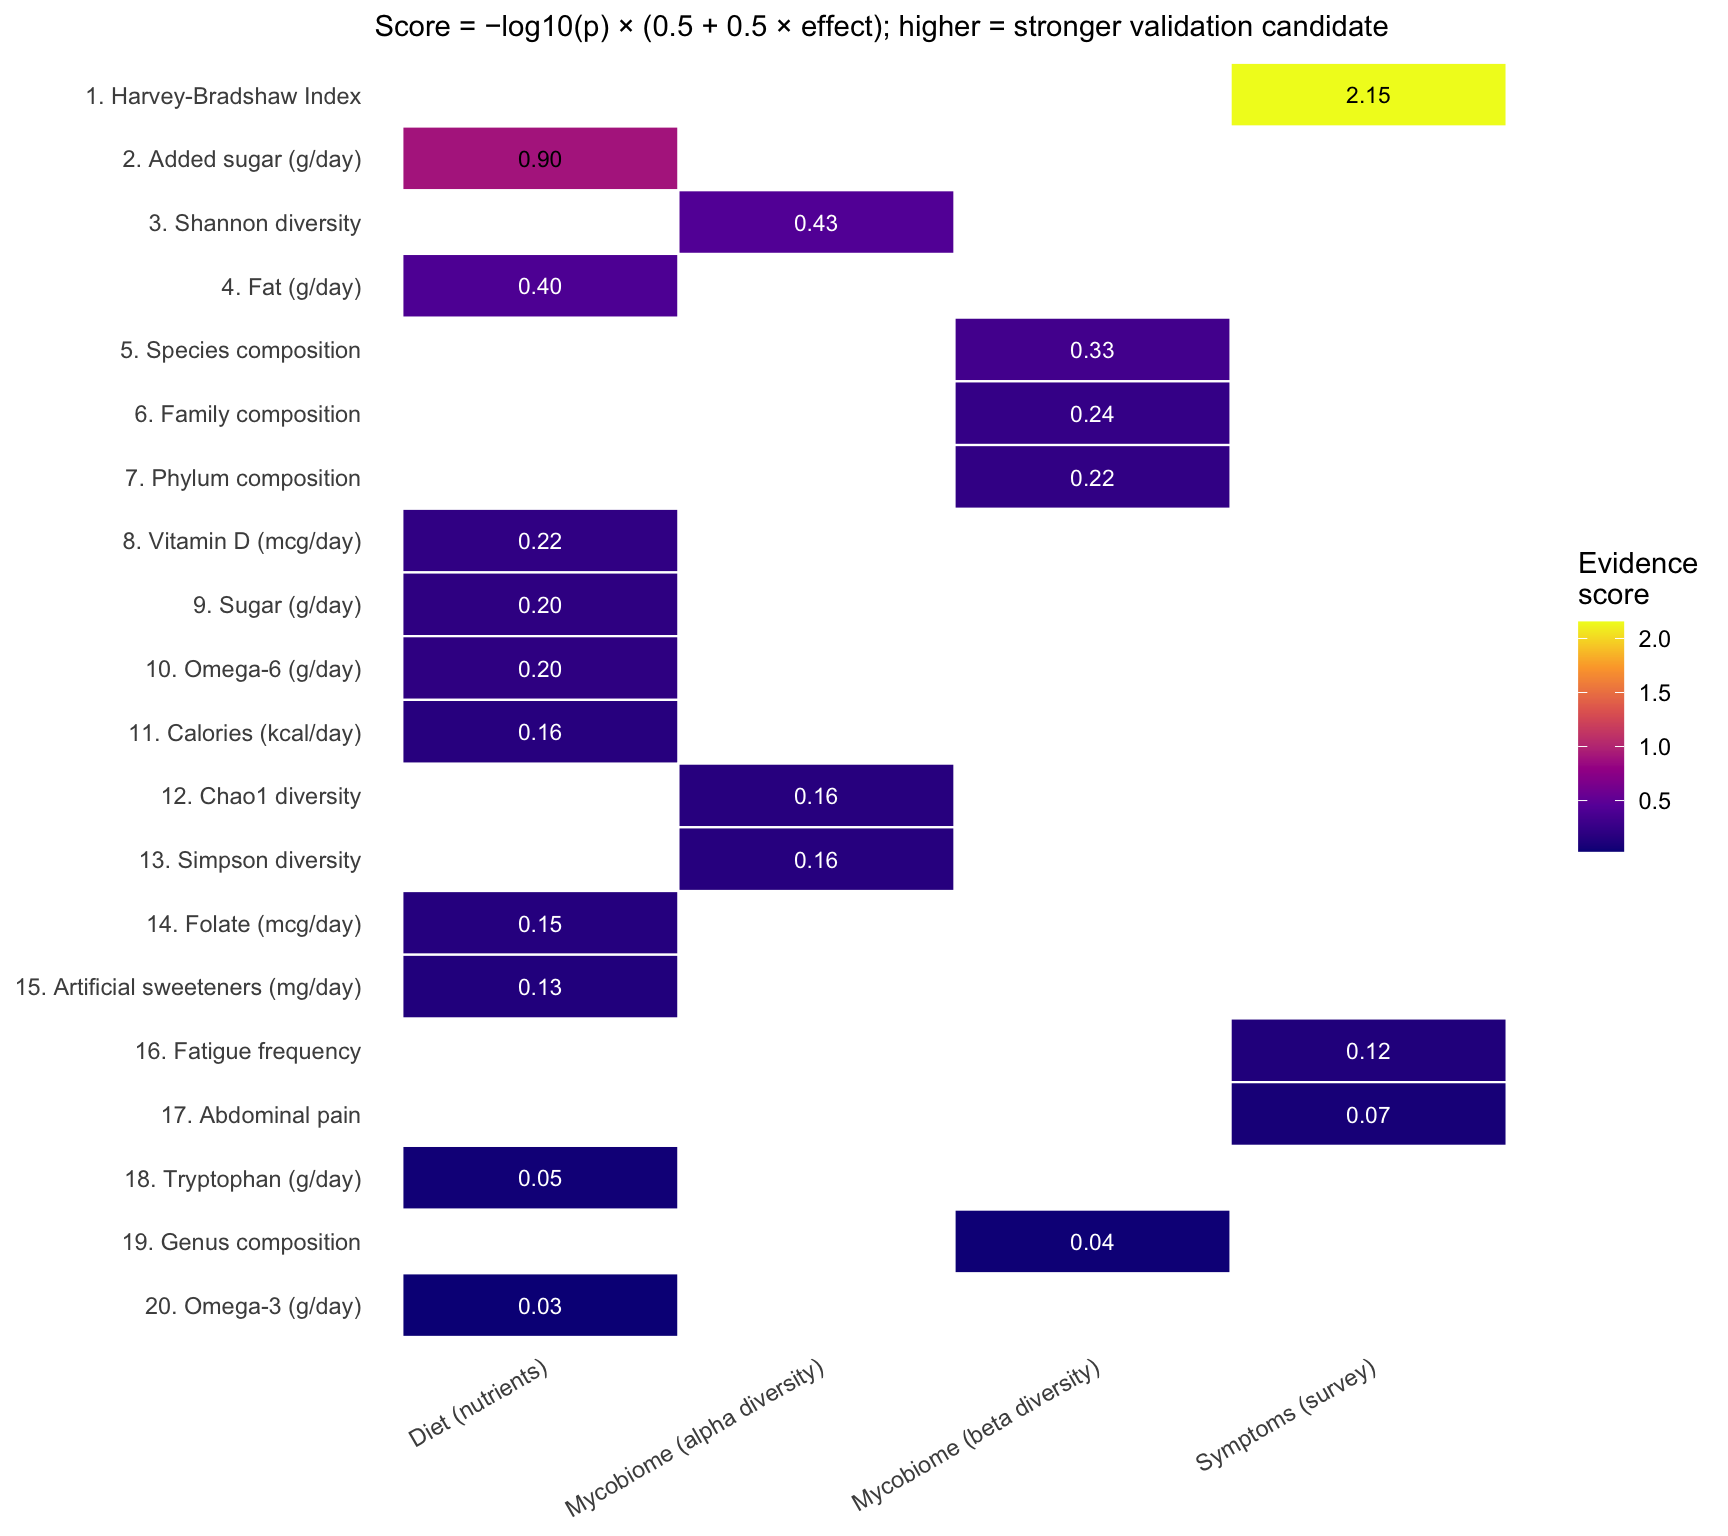
The matrix does not replace individual analysis posts; it prioritizes which disease-group contrasts to carry forward (e.g. pre-registration, larger cohort, or experimental follow-up).
High tier findings combine statistical significance with relatively large R² (composition) or η²[H] (rank-based outcomes). Low tier rows may still be biologically interesting but need replication. Domains with few participants (especially diet and symptoms) should be interpreted cautiously.
stats/R/evidence_ranking_helpers.Rquarto render stats from repository root