IBD Mycobiome Dashboard
IBD study data sat in four separate sources. With a UBC capstone team, I built a pipeline and dashboard for BC Children’s Hospital Research Institute.

Ian Gault
MSc Analytical & Environmental Toxicology (U of A) · Master of Data Science (UBC) · Registered Professional Biologist (RPBio)
I build pipelines, models, apps, and reports for laboratory, clinical, and environmental data. I started at the bench in analytical toxicology, so I understand how the numbers were made before I model them.
30+ projects of experience
in analysis and reporting over six years of regulated monitoring and risk assessment for oil sands, mining, municipal wastewater, and contaminated sites, including a US EPA Superfund site. I develop reusable, modular workflows that make each analysis faster and easier to extend to future projects.
Research scientist training
study design, biotic and abiotic environmental field sampling, sample extraction, mass spectrometry, bioanalytical methods, cell culture, water chemistry, toxicology, and human research, with 2 peer-reviewed publications and a hospital research partnership in IBD.
Modern data science
statistical modelling (descriptive, inferential, and Bayesian), machine learning (classification, clustering, and deep learning), spatial and temporal analysis, data visualization, data infrastructure (cloud computing on AWS, CI/CD, PySpark, and DuckDB), and LLM tooling.
Data are observations of the real world; models are abstractions of it. Good data science connects the two through careful measurement, rigorous modelling, and thoughtful presentation and interpretation.
From how the data were generated to the decisions they support. Each step starts from a problem I’ve seen in scientific data work.
Measure
“This result looks wrong, and nobody can say why.”
Start with how the data were generated: instruments, detection limits, and sampling design.
For example MSc research in analytical toxicology
Engineer
“We rebuild the same analysis by hand every year.”
Turn messy, multi-source data into reproducible, tested pipelines with built-in QA/QC checks.
For example Water Quality Harmonization
Model
“We’ve collected years of data and only run the standard test.”
Match the model to the pattern in the data and check its assumptions before trusting the result.
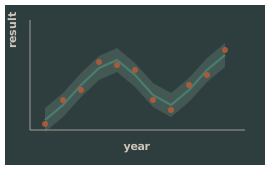
For example Modelling Beyond a Straight Line
Deploy
“The results live in a PDF or on one person’s laptop.”
Build reports, dashboards, and apps that people can use without opening the code.
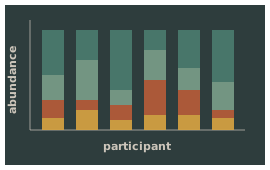
For example IBD Mycobiome Dashboard
Decide
“Will this hold up to review?”
Document steps; create reproducible environments; communicate results clearly enough to support decisions.
For example Six years of consulting
I’m looking for roles where I’m responsible for the pipelines and analysis behind scientific decisions, on teams working with lab, clinical, or environmental data.