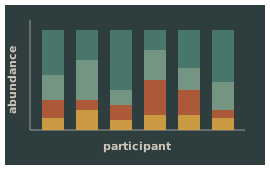
Shiny dashboard and statistics site linking gut fungi, diet, and inflammation in IBD, built with a hospital partner.
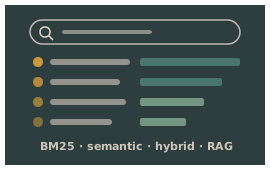
A Streamlit app comparing keyword, semantic, and hybrid product search, with RAG answers from product reviews.
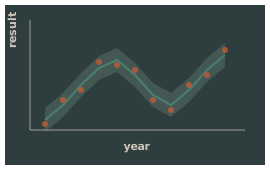
A practical guide to modelling water-quality trends that curve, plateau, or shift, from piecewise regression to GAMs.
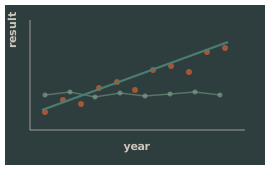
A reproducible R workflow for detecting linear, monotonic water-quality trends and comparing them across monitoring areas.
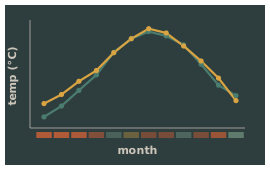
An interactive Python Shiny dashboard for exploring 150 years of global temperature trends, with an AI assistant.
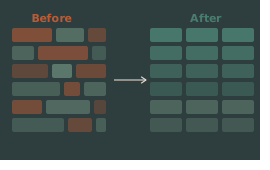
An R pipeline that turns multi-lab water-quality data with mixed units and naming into clean, analysis-ready tables.
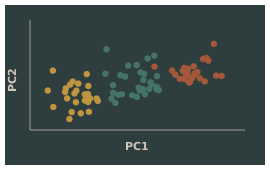
Customer segmentation using PCA, t-SNE, and five clustering methods, compared by silhouette score.