Credit Card Default Risk
The live app is on a free tier. If it has been idle, it can take up to a minute to start.
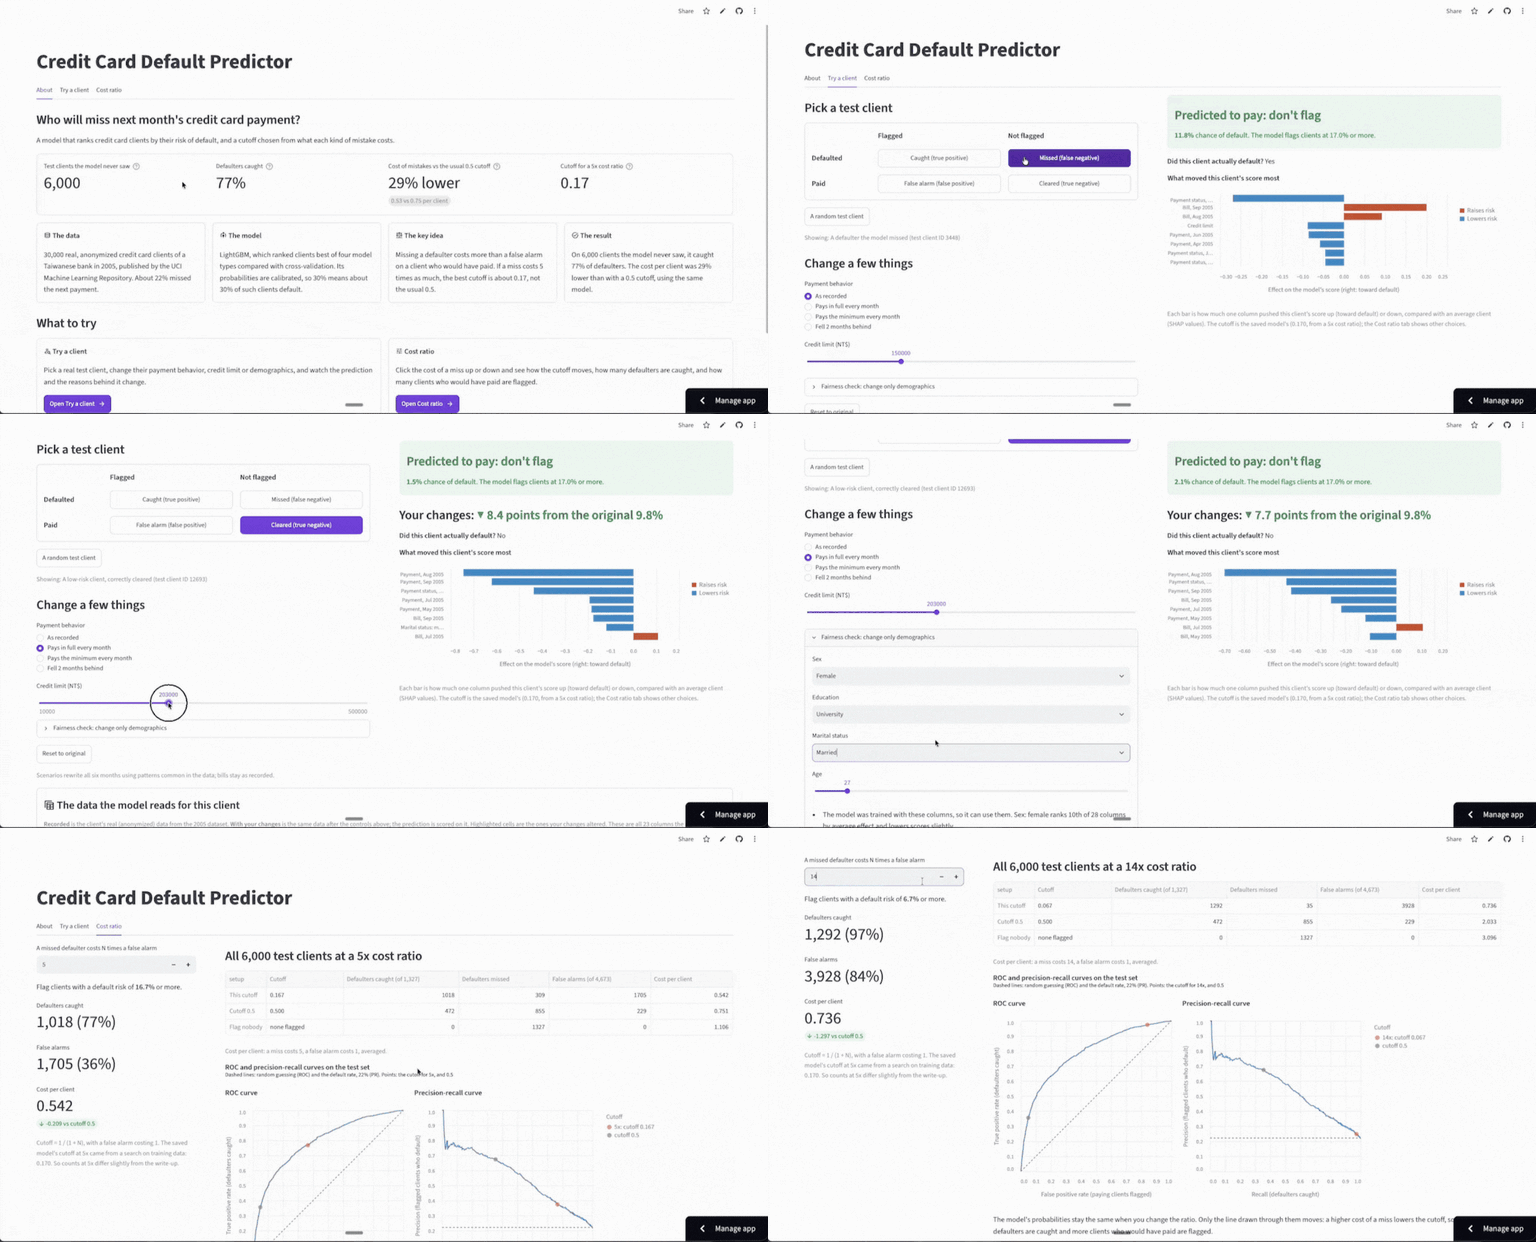
This project predicts which credit card clients will miss next month’s payment, using the Default of Credit Card Clients dataset: 30,000 clients of a Taiwanese bank in 2005, of whom about 22% defaulted. The model ranks clients by risk, and the cutoff for flagging a client comes from what each kind of mistake costs rather than the usual 0.5.
It grew out of a group lab by Vy, Christine, and Ian Gault for DSCI 573 (Feature and Model Selection) in the UBC Master of Data Science program. The pipeline, experiments, app, and write-up in the public repository are a separate, individual rebuild. It was built with Claude Code as an AI-assisted project: I set the goals and made the design and modelling decisions (how it was built).
What it does
- Try a client - pick a real test client (a defaulter the model caught or missed, a false alarm, or a correctly cleared client), change their payment behavior, credit limit, or demographics, and see the prediction and the columns that moved it most
- Cost ratio - change how much a missed defaulter costs compared with a false alarm, and see how the cutoff, the counts on 6,000 test clients, and the point on the ROC and precision-recall curves move
- About - the headline results and a short explanation of the approach
How it works
- Model comparison - four model types compared with 5-fold cross-validation on the training data; LightGBM ranked clients best (ROC-AUC 0.776)
- Class imbalance and engineered features - weighting defaulters, resampling (fewer paying clients, or synthetic defaulters), and engineered columns each changed ROC-AUC by about 0.01 or less, so the final model uses none of them
- Calibration - a calibration step corrects the model’s numbers so that a 30% score means about 30% of such clients default
- Cost-based cutoff - if a missed defaulter costs 5 times a false alarm, flagging is the cheaper choice above a probability of 1 / (1 + 5), about 0.17; a search over cutoffs on the training data found the same value
- Test set - 6,000 clients set aside at the start and scored once at the end; no choice about the model was made from them
- Explanations - SHAP values show which columns drive each prediction; last month’s repayment status matters most
The full walkthrough, with figures, is in docs/results.md.
Results
On the 6,000 test clients:
| Cutoff 0.17 (cost-based) | Cutoff 0.5 (default) | Flag everyone | |
|---|---|---|---|
| Defaulters caught (of 1,327) | 1,016 (77%) | 472 (36%) | 1,327 |
| False alarms (of 4,673 who paid) | 1,650 (35%) | 229 (5%) | 4,673 |
| Cost per client (miss = 5, false alarm = 1) | 0.534 | 0.751 | 0.779 |
Choosing the cutoff from the costs lowers the cost of mistakes per client by 29%, with the same model. Ranking quality (ROC-AUC 0.788) is in the range published for this dataset.
Technical stack
| Area | Tools |
|---|---|
| Modelling | scikit-learn, LightGBM, XGBoost, imbalanced-learn |
| Explanations | SHAP |
| Charts | Altair |
| App | Streamlit |
| Deployment | Streamlit Community Cloud |
| Reproducibility | conda, GNU Make, pytest, Ruff, GitHub Actions |
Fairness note
The model uses sex, marital status, and age, which is a fairness concern. In many places a lender could not base a decision on some of them. Checking error rates by group, and comparing the model with and without these columns, is listed as future work.